Figure 8: A Typical Thematic Map
In all fields, GIS research should focus on exploiting the ability to synthesize disparate data themes. The single variable thematic map is one of the most common GIS outputs, but decision makers rarely want to know how one variable varies across space. They want to know about the interaction of many different variables. This type of analysis lies at the heart of GIS, but the way software is currently configured, the user must be familiar with a plethora of software-specific commands to perform an analysis, which means that the help of a GIS specialist is usually required.
An environmental sensitivity analysis is one example of this kind of study. Data on vegetation, soil type, elevation, slope and aspect are synthesized to come up with some measure of environmental sensitivity for every point in the study area. Generally, scientists define the study parameters and then the GIS work is performed by a technician who applies those parameters to a data set and then generates a map.
The need for better GIS interfaces is currently being addressed by individual users who develop "modules" using the GIS package's scripting language (the fact that all major GIS packages have a scripting language is an acknowledgment of their weak user interface). Modules have been developed for forest management, political redistricting, bus routing, etc. This section can be thought of as an effort to build an urban design module.
There are five components to the construction of this system. First, it must be decided what are the important things to know about a city in order to understand it (Kevin Lynch proposed that a city's edges, nodes, paths, districts and landmarks must be known). Second, we must create computable algorithms for the identification of these "important things"--Rowe's descriptive model. Third, the user interface must strike a balance between simplicity and flexibility. Right now, GIS user interfaces err on the flexible side, allowing a multitude of operations if the user can figure out how to perform them. A GIS for urban design should be easily employed by an urban designer, so beyond the creation of functions with specific application to the urban design field, an interface should be created which maximizes the ability of the designer to explore the study area.
Fourth, an urban design module must be flexible in terms of the definition of algorithms. Urban design is different from most disciplines that use GIS in that there are few generally accepted procedures that are implemented the same way in every situation. Defining the "important things" that must be known about a place is an issue that many people have an opinion about, but no official body, like the American Planning Association, has set down any rules or even guidelines on this question. For example, we may think that an algorithm to find the shortest path from one place to another is an important tool, but a designer may think that the time or distance between two places is relatively unimportant to the design of an urban area when compared to issues such as safety, a feeling of home, etc. "Although attempts have been made to reduce design to completely explicit systems of search or synthesis, it remains an art, a peculiar mix of rationality and irrationality. Design deals with qualities, with complex connections, and also with ambiguities" (Lynch, 1981). So an urban design module must allow the user to create their own analysis tools, but in an easier way than simply providing a scripting language that is closer to programming than using an existing program. This last aspect will not be developed in the context of this work because of the extensive programming required. Instead, this work develops the system the way Lynch might have, and leaves the creation of a flexible interface to further research.
Fifth and finally, an urban design or planning GIS must incorporate some method of receiving input from the general public and organizing and synthesizing this information graphically. The importance of including the public in the planning process has been well documented,[9] but decision makers often exclude the public from the process by arguing that it is too expensive and time-consuming to hold numerous public meetings and try to come to some sort of group consensus. Information networking technology offers a forum for the public which could overcome these arguments. A general framework for this part of the system would include the provision of information to the public, a way for people to make comments with text and pictures (possibly also video and audio), a way for people to browse the comments of others and a way of synthesizing the input to get an idea of the collective view on the issue.
The scope of this work is to lay out all of the issues concerned with GIS and urban design, but to only go into depth on a small number of them. This section presents a prototype of the descriptive component of an urban design GIS. More specifically, it looks at how patterns in the landscape could be explored, it takes a detailed look at how to model Kevin Lynch-type nodes and discusses in broader terms how the other elements of Lynch's legible city might be modeled.
A short description of the key data layers is presented here while detailed source information can be found in Appendix B: Data Dictionary. The data layer used to represent street areas here actually consists of the area comprised of streets and sidewalks. No more detailed data set covering the entire city could be found for these features. The building footprints data layer represents the outlines of buildings as they would appear from an aerial view. No height information was included and in many cases, multiple buildings are represented as a single sha`e because of their proximity to one another. Parcels were obtained from the City of Boston, who created this data set for tax assessment purposes. Parcel-based data included land use, building value and land value. Aerial photography came from MassGIS, the Massachusetts agency responsible for compiling and disseminating state digital data. The photographs have a half-meter resolution and are geographically referenced and orthorectified, meaning that the picture has been adjusted to compensate for elevation and the angle of the photograph. This is done so that the viewer seems to be looking straight down on the scene and to maintain accurate sizes and shapes. Census data was simply downloaded from the Internet using the U.S. Census Bureau's service. All 1990 Census data is available in this way.
These five databases--streets, parcels, building footprints, aerial photographs and Census data--will be used in conjunction with local knowledge to generate an "understanding" of the urban environment. This understanding will be different depending on the needs and personal characteristics of each individual planner. In this work I use Kevin Lynch's model of understanding the urban environment as described in ]Image of the City. Although I use this model as an example, the real strength of this application will be its ability to be customized to process any designer's model of the city.
Landscape abstraction should transcend traditional human understanding of the physical world, and most importantly extend the limit of our perception of reality.Perron and Miller, 1991
I consider pattern finding to be a key aspect of any sketch planning GIS. Every designer will want a slightly different set of tools, but the ability to recognize and explore spatial patterns will be included in some way. This function, in its simplest form, takes thematic data sets and allows the user to combine them in various ways. For example, the user can quickly calculate and view all places that are predominantly residential, urban, run down, with a high rate of unemployment and comprised largely of non-native English speakers. This is accomplished by combining demographic, land use and city assessor's data. The utility of finding patterns is not the main focus here, but rather the ability to quickly process pattern finding requests that bring together multiple data sources. Kp>
So then the goal here is to create a tool which offers the designer more depth. The obvious way to accomplish this is to add multimedia elements to the GIS such as pictures, video, etc., but the amount of time and effort required to put develop that type of audio/visual database is too great. Instead, I try to create a greater depth of knowledge by allowing the user to quickly find areas that meet any number of conditions from any number of data layers.
This is a task to which GIS is well suited because of its ability to overlay spatially referenced data sets and contrast and compare their attributes. The way this is often done in GIS analyses is to choose a number of data sets, perform the overlay, and then classify the resulting data set's values into a thematic map. I did not want to use this method because it seems to presuppose a knowledge of which data sets to overlay and what value will be important in the end. Instead, I start with a place of interest. The user can find out everything about the place (limited only by what data sets are available). Then the user can find other similar places throughout the city. All of the intricate overlay commands are transparent to the user, so that they can concentrate on the exploration process.
In order to combine these ideas into a prototype pattern finding application, it was necessary to predict certain modes of operation for the hypothetical user--two are presented here. The first assumes that the planner has in-depth knowledge about one place--usually an street corner or a parcel, and wants to find out the underlying characteristics about this place as well as other places that have similar characteristics. The second is not based upon any one place. The user is allowed to enter any characteristics of interest and see how they compare.
The place-based method is modeled by having the user select a building in the area of interest. The program then allows the user to select any of the themes present in the database that is of interest to the analyst. In Figure 9a the user has selected population density. The next step is to decide what range of population density is important. The value at the location of the building (109.98) is given as a starting point, but the user decides that 100 is a better minimum value. The maximum value is chosen in the same manner, and then additional themes may also be added to the pattern. After all of the parameters are entered, the program finds all areas in Boston that meet all of the criteria.
In this way, information about one place can be used to help the user find other places that are likely to be similar without having to study every acre of the city in detail. This proves to be a very stimulating method of analysis, especially when places with similar characteristics turn out to look quite different "on the ground."
The non place-based method is similar to the place-based method, but the conceptual goal is quite different in that the user's interest is not focused on one specific place, but on a specific set of characteristics. The GIS aids the user in choosing a range of values for each characteristic by reporting certain statistics such as mean, maximum, minimum, standard deviation and quantiles.
These explorations become iterative when the designer takes the results of an analysis (which the program allows to become another data layer) and refines or expands that exploration path by further restricting the limits of a query or adding another query element or intersecting two separate analysis paths. As all the query results can be saved as spatial layers, they are all available for use as inputs into subsequent analyses. For example, the result of an analysis that finds areas that are sensitive to real-estate speculation might be important in studies of economic development zones, road and utilities upgrades, rent control, etc.
Blind pattern finding can be a powerful exploratory tool, but the designer often wants to start with a certain geographic boundary and understand what makes the area within the boundary different from the area without. This is not really pattern finding but pattern understanding, because what you want to know is why the pattern that has been observed exists. The amount of programming necessary to prototype this concept is beyond the scope of this work, but it is important to keep in mind because it represents the beginnings of a predictive, or planning model which would go beyond simply describing a place.
Figure 9: Place-based pattern finding
(a) the user interface
(b) Places similar to a building in the Mission Main public
housing development
Figure 10: Blind Patterns
Horizontal hatching: Areas vulnerable to commercial real-estate
speculation
Cross-hatching (look in lower right corner): The same areas with over 50% Black
population
Kevin Lynch, in The Image of the City, looks at the city as a place where many aspects of physical form and land use are controlled by individuals and not by centralized government, resulting in an environment which is constantly changing over time. Within this framework, however, there is a function for the city planner, and that function is to create an environment where residents can take emotional ownership over a large part of the city. Outside of this area that they think of as "theirs," there should be no consternation associated with navigating around the rest of the urban landscape. This vision of the city contains familiar, private home neighborhoods, lively commercial and civic centers, and navigable and easily identified paths between all of these districts. These building blocks of the urban environment are called nodes, paths, districts, edges and landmarks.
Lynch argues that understanding the city in this way will help planners be able to plan cities that work better for their inhabitants, but in his 1985 reflection on the book's impact, he is disappointed with the way his work was used. With his work in hand, planners felt that they could find these patterns on their own, with no resident input, when Lynch's theory was that the location of these nodes and boundaries of these districts must be ultimately defined by the public. This is why a system of sharing experience (discussed at the end of this section) is critical to the success of this model. While the physical environment will offer clues to the image of the city, the computer can not know how safe people feel on their street, or how many neighbors and shopkeepers they can identify by face. This information must come from individuals having input into the system, and this issue will continue to be discussed throughout the paper.
Nodes are points, the strategic spots in a city into which an observer can enter, and which are the intensive foci to an from which he is traveling. They may be primarily junctions, places of a break in transportation, a crossing or convergence of paths, moments of shift from one structure to another. Or the nodes may be simply concentrations, which gain their importance from being the condensation of some use or physical character, as a street-corner hangout or an enclosed square. Some of these concentration nodes are the focus and epitome of a district, over which their influence radiates and of which they stand as a symbol.The Image of the City, pp. 47-48
So nodes are either notable intersections of paths or concentrations of activity. In fact, these two definitions are self-reinforcing, as centers of activity often develop at important intersections, and paths are often created to service major nodes.
In Boston's South End, the Boston Center for the Arts (BCA) intersection (Figure 21B) is a neighborhood node. The BCA is a multi-purpose facility where art classes and exhibitions are held and artists lofts and studios are located. The block containing the BCA is on the north side of Tremont Street, with a small theater next door and a music school and a parking lot behind. Across from the BCA and along Tremont heading southwest are a number of small businesses including coffee shops, restaurants and antique stores. The Tremont/Berkeley Street intersection is a heavily traveled automotive path, with commuters on their way to and from the Massachusetts Turnpike and Interstate 93. Pedestrians from the surrounding residential areas use Tremont Street as a destination (for its cultural and commercial offerings) and as a path to downtown Boston, located north and east of the node. Many children are also seen in the area, as a number of schools are within a three block radius.
It is easy to picture a typical day in this node, with people hurrying to work and school in the morning, adults grabbing coffee and breakfast along the way and everyone avoiding the cars speeding along the streets towards the downtown office buildings. Mid-day is quieter. Those who are fortunate enough not to have to work visit the art exhibitions and stop in for a long lunch at a local café and maybe browse the antique stores, hoping for a great find. The afternoon brings a flurry of street activity as school lets out, and before you know it dinner is being served at the restaurants. The area may remain lively well into the evening if there is an art opening or a play that night.
This knowledge is a result of many visits to the area over the course of a three-month investigation of the neighborhood. The task here, however, is to identify this node solely through the use of our database (local resident input will be added to the system later). Earlier, nodes were defined as intersecting paths and/or centers of activity. Every street is a path--although paths do not have to be streets, but there are too many street intersections for this to be an unqualified definition of a node. Each may be a node in a micro reading of a site, but here we are concerned with neighborhood/city scale. Therefore, the following conditions will lead to a more accurate attribution of the term node for urban planning.
A place may be a node if it is situated along a major street. Major may be defined in an urban setting as a street of at least four car widths. This translates at the minimum into one lane of traffic in each direction, with parking on both sides. Sidewalk width is also important, as it influences people's ability to interact with each other in this public setting (sidewalk data is unfortunately often neglected in the construction of an urban database). [14] Wetlands are so important because they are the transition area between forests, fields and water. Being rich in food sources they also attract animals from the land, air and water. The same theory can be applied to the human species. Because of the varied needs of people, the greatest level of activity will be found in areas that service the greatest number of needs. The BCA is coded as commercial land use with institutional uses found to the west and east. Residential areas surround these public uses, which is crucial because public areas without nearby residential districts become ghost towns at night and on weekends.
One important characteristic of the area which is not reflected in the data is that the buildings on Tremont Street generally have commercial uses on the ground floor and apartments above (Figure 21A). The 1:25,000 land use database, however, codes these buildings simply as residential. A mixed use classification or a data structure which supported more than one classification for a given location would be more appropriate here, as is supported by the parcel-based land use data set. Agencies have resisted mixed use classifications because if you have 20 classes and you allow for each to be crossed with every other, there are 400 possible combinations. With 400 classes, the land use map is no longer significantly less complex than the real world, so once again you may need a GIS specialist in order to make sense of it. Agencies that create the database should be able to build in multiple levels of detail into a database either with a different data model than currently exists15 or with a different interface to the data than currently exists. The end user then has the freedom to choose the level of detail they need to complete the task at hand. The parcel-based land use data set offers a rich classification scheme (see Appendix B: Data Dictionary), but any aggregation must be performed by the user.
So this node can be generally defined as follows:
Starting from the assumption that the area around urban nodes must include commercial, residential and institutional uses, I use an algorithm (Figure 11) that searches the land use data set (Figure 12) in a 500-foot radius around every cell for different land uses. If the aforementioned three land uses are not present, then the point can not be a node. If they are present, the point is ranked in comparison to other nodes based upon how many different types of land use are present in the area. Next, since I am in the experimental stage (i.e. not yet at the point where I have decided upon only one way to find nodes), I perform the same analysis again using a 260 foot search radius (Figure 16), and then once again using a 1,000 foot search radius. I see that the 1,000 foot radius is to be to large because it searching an almost half-mile diameter area, which is too large to be considered a single place in this urban context, but the other two searches seem to hold promise.
During the course of this research (as often happens in real life) a more detailed source of land use data became available, so I am able to run the same 500-foot and 260-foot search radius analyses using parcel-based land use with an intermediate classification (Figures 17 and 18) and with a highly detailed classification scheme (Figures 19 and 20). The difference between the intermediate and detailed classification schemes is not only the number of categories, but also the purpose for which the categories were created. The intermediate scheme was one that came with the database (Figure 13)--it could have been geared towards tax assessment, utility maintenance, or something else. The detailed scheme was developed specifically for this study (Figure 14). This can be seen in the category labels to the left of the maps.
Figure 11: The Node finding algorithm
The process I used to evaluate the success rate of finding nodes at this initial stage was to simply see if the found nodes coincided with Lynch's study (Figure 4) and my knowledge of downtown Boston.[16] The area of the city most Bostonians are familiar with consists of the Fenway/Kenmore, Back Bay/Beacon Hill, South End, and Central neighborhoods (Figure 23: City-defined Districts). There were three nodes here that I used as benchmarks, Kenmore Square, The BCA corner and Newbury Street.
Kenmore Square is a major city-wide node (Figure 21C). The roads coming together here are eight lanes wide in some sections. The effect of this is mitigated by a strip of useable area separating the two directions of traffic. Most of this strip is used as a park, but near the actual intersection there is a bus and subway station in this zone. The many diverse businesses include restaurants, music stores, a funeral parlor, the Boston University Bookstore, nightclubs, convenience stores, clothing stores and coffee shops. These are supported by Boston University, apartments and hotels, the baseball park, and a nearby street that serves as "nightclub row."
The BCA corner is a more subtle, neighborhood node. Only people who live or work in the South End are likely to frequent this area. Exceptions are those who are coming to the BCA for an event or in their car cutting through the South End on their way to the highway. The nature of the stores reflect this. They are mostly convenience stores, small restaurants and dry cleaners. Newbury Street is another major node, but it is different in that it is linear. The street is lined with shops that appeal to tourists and the wealthy, as well as eating places for locals.
The areas found with the 1:25,000-scale land use and a 500-foot search radius included the three test nodes mentioned above, but many other areas were also found. These did appear to be more active than the areas that were not found, but there was not enough of a distinction between places for the operation to be useful. Also, although the test areas were found, they were ranked lower than areas that are actually less active. Searching a 260-foot radius reduced the amount of area selected, but did not help in better identifying actual nodes. Similar problems resulted from the analysis using parcel-based land use and the intermediate classification scheme. Too much of the city was identified as "node-like" and the ranking of areas did not correspond well to the actual distribution of activity. This is a result of the classification scheme having little relation to urban design issues (Figure 13). The only category that was not residential, commercial or institutional is industrial, and what this categorization scheme emphasizes is the differing densities of residential areas. Although it may seem obvious that this description of land use would not be useful, I wanted to run the analysis with it to show how important the base data and categorization is to obtaining useful information.
The detailed classification scheme includes a number of important disaggregated land use categories. Institutional use is separated into schools, hospitals, library/museum/galleries, religious and other. Industrial use is separated into light industry, manufacturing and utilities. Commercial use is separated into retail, hotels, restaurants/bars and offices. These important differences in land use allow the node finding function to create highly descriptive and useful nodes (Figures 19 and 20), although this data set did not identify the BCA node. The major difference between the 500-foot and 260-foot detailed land use nodes is the size of the area identified. It seems that concentration of activity is better represented by the 260-foot search radius, but the data is not accurate enough (or the node finding function is not fine-tuned enough) for this search to work as well as the 500-foot radius search. In other words, the 260-foot radius is closer to the actual size of a node, but we must find larger, more general areas because even the parcel-based land use data set has drawbacks. For example, the BCA node was not found in large part because the land use data does not classify the buildings along Tremont Street. For some reason these areas were left out of the data set.
Once the algorithm was fine-tuned and studied in the lab as described above, I was ready to investigate the nodes that had been found in other parts of the city. This two-step process of building theory and associated algorithms in the office and then field-checking the theory reflects the general idea that the GIS should allow the designer to apply their knowledge about a small area to the entire city. I used my knowledge of downtown Boston to formulate an algorithm that would identify areas I consider nodes and then the algorithm applied that concept to the rest of the study area. In fact, the algorithm was extremely successful in performing this task, although this success is difficult to prove because design methods are inherently difficult to quantify. A photographic presentation (Figure 21) of the nodes is the best way to describe them without labor-intensive pedestrian and traffic counts or video. All photographs were taken between 9:00AM and 5:00PM on weekdays.
The difficulty in creating the node finding algorithm had more to do with data and computing resources than with conceptual issues. Without the parcel-based land use data set, this study would not have been successful. This is significant because very few cities have developed digital data sets at this level of detail, but detail is crucial to studies of the urban environment. Computing power is also an issue. This analysis would not have been possible with the kind of computing power currently available in personal computers. UNIX workstations were used, and even then it was only feasible to analyze a portion of the city, which itself is only a portion of the metropolitan area. Progress in the detail of data sets and computational power will make experimentation in this area much more practical in the future.
Figure 12: The BCA node as described by the 1:25,000 land use data
set
click for full-scale image
Figure 13: The BCA node as described by the parcel-based land use data
set
with an intermediate classification scheme
click for full-scale image
Figure 14: The BCA node `s described by the parcel-based land use data
set
with a detailed classification scheme
click for full-scale image
Figure 15: Nodes derived from 1:25,000 scale land use
and a 500-foot search
radius
click for full-scale image
Figure 16: Nodes derived from 1:25,000 scale land use
and a
260-foot search radius
click for full-scale image
Figure 17: Nodes derived from parcel-based land use
with an
intermediate classification scheme and a 500-foot search radius
click for full-scale image
Figure 18: Nodes derived from parcel-based land use
with an
intermediate classification scheme and a 260-foot search radius
click for full-scale image
Figure 19: Nodes derived from parcel-based land use
with a detailed
classification scheme and a 500-foot search radius
click for full-scale image
Figure 20: Nodes derived from parcel-based land use
with a detailed
classification scheme and a 260-foot search radius
click for full-scale image
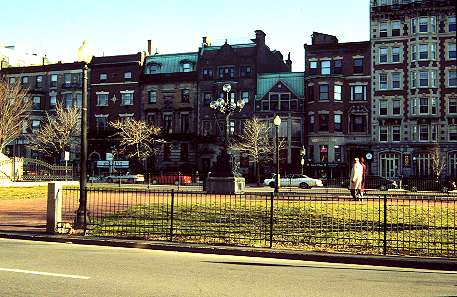
Figure 21: Photographs of nodes around the city
(A) Dudley & Warren
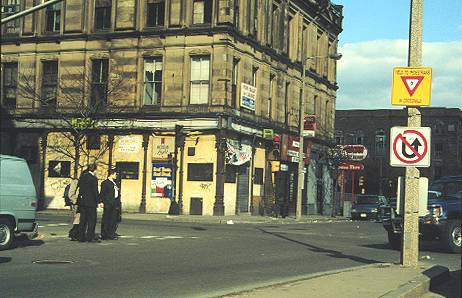
(B) The BCA (Tremont &Union)
(C) Kenmore Square (Commonwealth Avenue)
(D) Downtown Crossing
(E) Centre and Buckford
r>
(F) Uphams Corner
Figure 22: Key to the Nodes Photographs
Districts are medium-to-large sections of the city, conceived of as having two-dimensional extent, which the observer mentally enters "inside of," and which are recognizable as having some common, identifying character. Always identifiable from the inside, they are also used for exterior reference if visible from the outside. Most people structure their city to some extent in this way, with individual differences as to whether paths or districts are the dominant elements. It seems to depend not only upon the individual, but also upon the given city.The Image of the City, p. 47
The easiest way to explain the concept of district is by example. In Boston, the South End, the North End, Back Bay and the Financial District are obvious districts. New York has Greenwich Village, Soho, Wall Street, Harlem and countless others. Although specific boundaries may be hard to agree upon, the general existence and location of most districts are easy for residents to acknowledge.
A useful distinction can be made here between a neighborhood district and a physical district. Defining neighborhood districts using digital data is difficult because the boundaries may be based on historical events, informal gang (south-central Los Angeles) or politician-controlled areas, elevation (Beacon Hill, Boston), etc. Some of these factors have some physical form and can therefore be captured in a GIS, but some will not. Furthermore, physical form may lead the designer into misclassifying a neighborhood. For example, Boston's South End crosses over Massachusetts Avenue, a street so wide that planner unfamiliar with the area would assume that no neighborhood could cross that barrier.
The issue of defining districts for Boston was aided by the fact that one of the data sets available specifically addresses this issue by outlining and naming the eighteen neighborhoods of the city (Figure 23: City-defined districts). An interesting use of the inverse pattern finding application described at the end of this paper would be to take one of these neighborhoods and ask what is different about it as compared to the rest of the city, or adjacent neighborhoods. In this way the accuracy and usefulness of the neighborhood data set could be evaluated. Districts are an important macro-level concept of neighborhood, but micro-districts are also crucial to a sense of comfort in the city. These districts would be a number of blocks, rather than a section of the city. This is the area in which many of the faces should be familiar. Christopher Alexander describes this as Pattern 14: Identifiable Neighborhood, which says, "People need an identifiable spatial unit to belong to." 17 The district as Lynch defines it would be a closer match to Pattern 12: Community of 7000, which states, "Individuals have no effective voice in any community of more than 5000=10,000 persons."[18]
Alexander's definition of community is reflected in the dividing up of Boston into wards, the smallest political unit in the city. Neighborhood boundaries can be explored using traditional thematic mapping techniques. The three districts generated in Figure 23 are shaded by taking the minimum and maximum values for the attribute in question (median family income, percent Asian and percent Black) and dividing that range into four equal ranges. The Back Bay/Beacon Hill area is home to the only city residents whose average income is more than the city's average of $35,532 (Figure 23: A high income district). Boston's Chinatown district appears clearly by classifying the city by percentage Asian population. Only the small Chinatown area has a greater than 50% Asian population in each block group (Figure 23: An Asian district). Similarly, Blacks seem to be concentrated in Roxbury and Mattapan.
Figure 23: Identifying Districts
City-defined districts
A high income district
click for full-scale image
An Asian district (Chinatown)
click for full-scale image
A Black district
click for full-scale image
Paths are the channels along which the observer customarily, occasionally, or potentially moves. They may be streets, walkways, transit lines, canals, railroads. For many people, these are the predominant elements in their image. People observe the city while moving through it, and along these paths the other environmental elements are arranged and related.The Image of the City, p. 47
Roads and transit lines are easily included in a GIS, the difficulty comes in classifying them according to use. Road width is one way to obtain a rough idea of how heavily used a street is for vehicular traffic, but this is only one type of path. Jacobs suggests that the number of intersections one street has with others is a good indicator of how busy and interesting a street will be because more intersections implies a greater potential to be part of the route to more destinations.[19] For example, one would only find people who are going somewhere on that street on a long street with no intersections.
Since paths are channels along which people customarily move and nodes are places at which people customarily meet, it is logical that people will customarily move from node to node. This suggests a different method of defining paths. Instead of going back to the original data sources to model the path concept, it can be constructed from the nodes model. This theory works particularly well for Newbury Street (along the northeastern portion of Figure 20). This street is used by many go from the western part of downtown Boston to the financial district in the northeast. It is more frequently used than the completely residential streets to its north because it offers the opportunity to see more people, have a snack or window shop.
Apart from being a connection of nodes, the classification of paths proved to be the most difficult concept of Lynch's to model. Transportation data is rarely very detailed, due to the time and expense associated with pedestrian and traffic counts and classifying a street as a single unit when its name may change along its route. Because of this lack of helpful data sources, this is one area in which I do not foresee GIS being immediately helpful to urban design.
Edges are the linear elements not used or considered as paths by the observer. They are the boundaries between two phases, linear breaks in continuity: shores, railroads cuts, edges of development, walls.The Image of the City, p. 47
The identification of hard edges may clearly be aided by GIS. Many times a district will be constructed using one type of data (demographics) and the edge will be formed by another (streets, rail lines, water features). The overlay and intersection capabilities of GIS allow this type of analysis to be performed in a straightforward manner. That addresses the question of hard edges, but Lynch also identifies soft edges, which he calls seams. Soft edges separate distinct regions but have no easily observable edge element.
Soft edges can be roughly identified with GIS because edges must be defined in the creation of any vector-based data set. For instance, the Census data used was based on block groups. These are usually two to four city block areas that U.S. Census Bureau researchers have decided are similar enough to aggregate into a block group. The 1:25,000 land use data set also required a trained professional to decide where one area ended and the next began. This was not a problem with the parcel-based data because lot lines served as the edges.
Landmarks are another type of point-reference [like nodes], but in this case the observer does not enter within them, they are external. They are usually a rather simply defined physical object: building, sign, store, or mountain...They may be within the city or at such a distance that for all practical purposes they symbolize a constant direction... They are frequently used clues of identity and even of structure, and seem to be increasingly relied upon as a journey becomes more and more familiar.The Image of the City, p. 48
Finding landmarks would be one of the most difficult tasks for a traditional GIS. As directional guides, they are often taller than other landscape features, which makes them difficult to distinguish with data sets that rarely include object heights. Many objects become landmarks because they stand out from their surroundings in other ways, like appearance, and this characteristic is also rarely captured in a database.
The best way to identify landmarks is through resident input. In fact, one of Lynch's main points is that all of the preceding elements of the city should be identified using the experience of the people that define them through their daily activities.
Lynch put forth the effort to interview individuals, but each interview took at least two hours, so his technique could not be considered an implementable model in the context of a city government working within a limited budget. Advances in networking technologies and electronic communication should make the collection and analysis of public opinion on local issues more common, but research on integrating GIS and public input is still in its infancy.
Lynch asks four questions of his interviewees. Draw a sketch map of the area showing interesting and important features, sketch the route and events along an imaginary trip, list parts of the city felt to be most distinctive, and describe where a few objects are located. Instead of sitting down with a person and asking these questions, they can now be asked and answered with a computer. As we may soon reach the point in America where a large and diverse portion of the citizenry could be reached through electronic networks, Lynch's technique should be revisited with these new tools in mind.